I've finally been able to acquire the compressor "maps" (they're actually just x-y line plots) for the Autorotor MX422 (2.2L) and MX424 (2.4L) superchargers from Opcon. The map for the 2.3L Lysholm (LYS2300AX) is on their web site at: http://www.opconab.com/www/files/lysholm/pdf/performance charts/diagram_lys2300ax.pdf. (Thanks go to Vector for finding those.)
Using the data from these maps, I've gone through and analyzed each while running at the same ambient conditions and the same boost pressure of 1 bar (= 14.5 psi). I also have the maps at lower boost pressures, but I felt there'd be little interest in anything less that 1 bar, so I didn't analyze those. The goal is to look at the volumetric and adiabatic efficiencies, (from which nearly all other performance characteristics can be derived), at the same boost pressure. Since all three of these units are twin-screw designs, it stands to reason that they'd be very similar in these regards.
But before seeing how it comes out, first some background theory and variable definitions, (just in case they're not obvious). Note, subscripts "sc" or "e" imply supercharger or engine, respectively. I've left out all the derivations. I'm only including this to validate the analysis. For those that already know all of this, or if you don't care about the theory and are willing to just take my word for it, feel free to skip it.
VE = volumetric efficiency
AE = adiabatic efficiency
CID = cubic inch displacement (in³)
CFM = volumetric flow rate (ft³/min)
mdot = mass air flow rate (lb/min)
Cp = specific heat of air = 0.34 (HP-sec)/(lb-°F) = 0.0567 (HP-min)/(lb-°F)
ρ = air density (lb/ft³)
ΔT = SC outlet to inlet temperature difference (°F)
Ptot = total manifold pressure (psi)
Pboost = boost pressure (psi)
Patm = atmospheric pressure (psi)
Tamb = ambient temperature (°F)
PR = crank-to-supercharger pulley ratio
HPsc = supercharger drive power (HP)
To keep things simple, assume an ideal intercooler so that Boyle's law can be applied. Therefore, it can be shown that the total manifold pressure (boost pressure plus atmospheric) for these positive-displacement superchargers is given by the expression
(1) Ptot = Patm*(SC air flow rate)/(engine air flow rate) = Patm(CFMsc/CFMe)
The volumetric-flow rate of a positive-displacement supercharger is given by,
(2) CFMsc = VEsc*CIDsc*RPMsc/1728
The volumetric-flow rate for the (4-cycle IC) engine (NA) is given by
(3) CFMe = 0.5*VEe*CIDe*RPMe/1728
Therefore, since RPMsc/RPMe = (crank pulley diameter)/(blower pulley diameter) = PR it follows from (1) - (3) that the total manifold pressure can be written as
(4) Ptot = Patm(2*PR)(VEsc*CIDsc)/(VEe*CIDe)
And boost pressure is simply Pboost = Ptot - Patm. Therefore, since the three compressors all have different displacements, to evaluate VE, AE or supercharger-drive power at the same boost pressure, they must all be spun at different rates, (i.e., with different pulley ratios). To first order, the compressor speed need only be adjusted in inverse proportion to CIDsc relative to that of the "reference" blower. However, since VEsc vs. blower rpm may not be the same for each blower, the boost pressure may not be exactly equal at all speeds while taking this approach. Since the basic designs are the same (twin screw), this is likely to be a second-order effect. Nonetheless, it is what one will actually experience in practice since the pulley ratio is fixed.
---------------------
Aside:
If the compressors are spun at the same speeds, clearly the one with the largest effective displacement, (VEsc*CIDsc), would make the most boost, and hence, more net power. (Yes, power and torque are increased by increasing the mass of air and fuel going into the engine, but that doesn't mean that boost pressure is meaningless - for a given engine, exhaust system, etc., increasing boost is a simple and effective way of increasing the mass of air and fuel that's going into the engine. To be sure, improving the volumetric efficiency of the engine is more efficient since there's no drive power penalty or extra heating, but let's dispel the myth that boost pressure is meaningless.)
---------------------
Alternatively, VE, AE or HPd of the different blowers can all be plotted vs. the volume-flow rate (CFMsc). Although this insures the same boost pressure between the blowers at any given flow rate, this isn't physically realizable in practice. However, it makes the analysis easier since the data can be taken right off the maps without having to scale the blower speeds.
Therefore, since the blowers are all run at the same boost pressure and the intercooler is assumed ideal, (i.e., IAT2 = ambient temp), net engine power produced will only be dependent on any difference in drive power req'd by the different compressors.
Now if the compressors were ideal, they would all consume the same amount of energy to compress the air since boost pressure is constant. This process is referred to as adiabatic compression wherein by definition, no heat is lost (or gained) from the surroundings and hence, all of the mechanical energy required to compress the air is converted to heat energy which raises the temperature at the outlet of the supercharger. (Yes, I know there is an intercooler here, but this doesn't change the definition of adiabatic compression. And it still takes energy to compress the air, which is converted into heat energy, and then thrown away by the intercooler. Hence, there's still a power loss.) This increase in temperature is the theoretical minimum that can be achieved, and is a function of the boost pressure, and inlet pressure and temperature. However, in reality, there will always be some friction (both mechanical and air friction), which results in additional heat and hence, power loss. Since frictional losses are not necessarily the same for each blower, the extra power consumed due to these losses may not necessarily be the same for each blower. These additional frictional losses are characterized by the so-called adiabatic efficiency. The adiabatic efficiency is defined as the adiabatic drive power divided by the actual drive power, or by the adiabatic temp rise divided by the actual temp rise. These are equivalent definitions. It can be shown that the temp rise from the inlet to outlet is given by
(5) ΔT = (460 + Tamb)[(1 + Pboost/Patm)^(2/7) - 1]/AE
And that the SC drive power loss is given by
(6) HPsc = mdot*Cp*ΔT
where mdot is the mass-air flow rate in lb/min as given by
(7) mdot = ρ*CFMsc
and ρ is the ambient air density in lb/ft³.
What's not included in the analysis? Note that HPsc as given by (6) does not include any inertial losses. The primary inertial power loss would go as usual, by P = I*α*ω where I = mass moment of inertia of the rotors, α = angular acceleration (rad/sec²), and ω = angular velocity (rad/sec). In general, since the larger blower will have larger rotors, their mass moment of inertia would generally tend to be larger. But since the compressors would have to be spun at a lower speed for the same boost pressure on a given engine, this would tend to cancel the increased moment. Other internal design changes could change all this, however. There are other factors that occur in the real world that don't come in to play during the testing used to generate these blower maps, which can change the final results also. For example, there isn't an infinite number of pulley sizes available to choose from. Therefore, one would not necessarily be able to run the various SCs at the same boost levels in practice. As another example, any real intercooler isn't 100% efficient either. As a result, a blower with a higher AE will result in a lower IAT2. Obviously the lower the IAT2 at a given boost pressure, the denser the air and the more power will be produced. (However, since mdot had to go up to maintain the same boost pressure at the lower IAT2, so does the drive power, which tends to offset some of the gain.) A lower IAT2 may also cause the ECU to add more timing (depending on the max total timing commanded, etc.) resulting in an increase in power. All these sorts of things are left out. The above analysis only takes into account the differences of AE and VE of the blowers as reported on the compressor maps available in the public domain. The maps for all three blowers came directly from the respective manufacturers. If the data on these maps is inaccurate or not reflective of typical product for some reason, then obviously the end results can be different. I'm only reporting here based on the data found in those maps. The results may also be different at different boost levels.
Compared to the stock Roots-type Eaton supercharger, all three of these blower upgrades are a big improvement! A previous analysis of the 2.3L Lysholm and Eaton M112 can be found here (see post #16&17): http://www.modularfords.com/showthread.php?t=16208
And here's a link to a related thread that you may find of interest.
http://www.modularfords.com/2003-20...eness-of-engine-ve-changes-with-a-positive-displacement-supercharger-41735.html
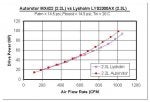
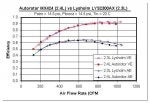
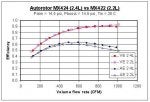
OK…but enough of all that - on to the results. The first graph shows the VE and AE vs. CFMsc for the Lysholm 2.3L and Autorotor 2.2L compressors, and the second graph shows the resulting drive power vs. air flow. The same ambient conditions and boost pressure are used in both cases. Again, no inertial losses are included. The third and fourth graphs show these same parameters for the Lysholm 2.3L and Autorotor 2.4L compressors, again at a boost pressure of 1 bar = 14.5 psi.
Using the data from these maps, I've gone through and analyzed each while running at the same ambient conditions and the same boost pressure of 1 bar (= 14.5 psi). I also have the maps at lower boost pressures, but I felt there'd be little interest in anything less that 1 bar, so I didn't analyze those. The goal is to look at the volumetric and adiabatic efficiencies, (from which nearly all other performance characteristics can be derived), at the same boost pressure. Since all three of these units are twin-screw designs, it stands to reason that they'd be very similar in these regards.
But before seeing how it comes out, first some background theory and variable definitions, (just in case they're not obvious). Note, subscripts "sc" or "e" imply supercharger or engine, respectively. I've left out all the derivations. I'm only including this to validate the analysis. For those that already know all of this, or if you don't care about the theory and are willing to just take my word for it, feel free to skip it.
VE = volumetric efficiency
AE = adiabatic efficiency
CID = cubic inch displacement (in³)
CFM = volumetric flow rate (ft³/min)
mdot = mass air flow rate (lb/min)
Cp = specific heat of air = 0.34 (HP-sec)/(lb-°F) = 0.0567 (HP-min)/(lb-°F)
ρ = air density (lb/ft³)
ΔT = SC outlet to inlet temperature difference (°F)
Ptot = total manifold pressure (psi)
Pboost = boost pressure (psi)
Patm = atmospheric pressure (psi)
Tamb = ambient temperature (°F)
PR = crank-to-supercharger pulley ratio
HPsc = supercharger drive power (HP)
To keep things simple, assume an ideal intercooler so that Boyle's law can be applied. Therefore, it can be shown that the total manifold pressure (boost pressure plus atmospheric) for these positive-displacement superchargers is given by the expression
(1) Ptot = Patm*(SC air flow rate)/(engine air flow rate) = Patm(CFMsc/CFMe)
The volumetric-flow rate of a positive-displacement supercharger is given by,
(2) CFMsc = VEsc*CIDsc*RPMsc/1728
The volumetric-flow rate for the (4-cycle IC) engine (NA) is given by
(3) CFMe = 0.5*VEe*CIDe*RPMe/1728
Therefore, since RPMsc/RPMe = (crank pulley diameter)/(blower pulley diameter) = PR it follows from (1) - (3) that the total manifold pressure can be written as
(4) Ptot = Patm(2*PR)(VEsc*CIDsc)/(VEe*CIDe)
And boost pressure is simply Pboost = Ptot - Patm. Therefore, since the three compressors all have different displacements, to evaluate VE, AE or supercharger-drive power at the same boost pressure, they must all be spun at different rates, (i.e., with different pulley ratios). To first order, the compressor speed need only be adjusted in inverse proportion to CIDsc relative to that of the "reference" blower. However, since VEsc vs. blower rpm may not be the same for each blower, the boost pressure may not be exactly equal at all speeds while taking this approach. Since the basic designs are the same (twin screw), this is likely to be a second-order effect. Nonetheless, it is what one will actually experience in practice since the pulley ratio is fixed.
---------------------
Aside:
If the compressors are spun at the same speeds, clearly the one with the largest effective displacement, (VEsc*CIDsc), would make the most boost, and hence, more net power. (Yes, power and torque are increased by increasing the mass of air and fuel going into the engine, but that doesn't mean that boost pressure is meaningless - for a given engine, exhaust system, etc., increasing boost is a simple and effective way of increasing the mass of air and fuel that's going into the engine. To be sure, improving the volumetric efficiency of the engine is more efficient since there's no drive power penalty or extra heating, but let's dispel the myth that boost pressure is meaningless.)
---------------------
Alternatively, VE, AE or HPd of the different blowers can all be plotted vs. the volume-flow rate (CFMsc). Although this insures the same boost pressure between the blowers at any given flow rate, this isn't physically realizable in practice. However, it makes the analysis easier since the data can be taken right off the maps without having to scale the blower speeds.
Therefore, since the blowers are all run at the same boost pressure and the intercooler is assumed ideal, (i.e., IAT2 = ambient temp), net engine power produced will only be dependent on any difference in drive power req'd by the different compressors.
Now if the compressors were ideal, they would all consume the same amount of energy to compress the air since boost pressure is constant. This process is referred to as adiabatic compression wherein by definition, no heat is lost (or gained) from the surroundings and hence, all of the mechanical energy required to compress the air is converted to heat energy which raises the temperature at the outlet of the supercharger. (Yes, I know there is an intercooler here, but this doesn't change the definition of adiabatic compression. And it still takes energy to compress the air, which is converted into heat energy, and then thrown away by the intercooler. Hence, there's still a power loss.) This increase in temperature is the theoretical minimum that can be achieved, and is a function of the boost pressure, and inlet pressure and temperature. However, in reality, there will always be some friction (both mechanical and air friction), which results in additional heat and hence, power loss. Since frictional losses are not necessarily the same for each blower, the extra power consumed due to these losses may not necessarily be the same for each blower. These additional frictional losses are characterized by the so-called adiabatic efficiency. The adiabatic efficiency is defined as the adiabatic drive power divided by the actual drive power, or by the adiabatic temp rise divided by the actual temp rise. These are equivalent definitions. It can be shown that the temp rise from the inlet to outlet is given by
(5) ΔT = (460 + Tamb)[(1 + Pboost/Patm)^(2/7) - 1]/AE
And that the SC drive power loss is given by
(6) HPsc = mdot*Cp*ΔT
where mdot is the mass-air flow rate in lb/min as given by
(7) mdot = ρ*CFMsc
and ρ is the ambient air density in lb/ft³.
What's not included in the analysis? Note that HPsc as given by (6) does not include any inertial losses. The primary inertial power loss would go as usual, by P = I*α*ω where I = mass moment of inertia of the rotors, α = angular acceleration (rad/sec²), and ω = angular velocity (rad/sec). In general, since the larger blower will have larger rotors, their mass moment of inertia would generally tend to be larger. But since the compressors would have to be spun at a lower speed for the same boost pressure on a given engine, this would tend to cancel the increased moment. Other internal design changes could change all this, however. There are other factors that occur in the real world that don't come in to play during the testing used to generate these blower maps, which can change the final results also. For example, there isn't an infinite number of pulley sizes available to choose from. Therefore, one would not necessarily be able to run the various SCs at the same boost levels in practice. As another example, any real intercooler isn't 100% efficient either. As a result, a blower with a higher AE will result in a lower IAT2. Obviously the lower the IAT2 at a given boost pressure, the denser the air and the more power will be produced. (However, since mdot had to go up to maintain the same boost pressure at the lower IAT2, so does the drive power, which tends to offset some of the gain.) A lower IAT2 may also cause the ECU to add more timing (depending on the max total timing commanded, etc.) resulting in an increase in power. All these sorts of things are left out. The above analysis only takes into account the differences of AE and VE of the blowers as reported on the compressor maps available in the public domain. The maps for all three blowers came directly from the respective manufacturers. If the data on these maps is inaccurate or not reflective of typical product for some reason, then obviously the end results can be different. I'm only reporting here based on the data found in those maps. The results may also be different at different boost levels.
Compared to the stock Roots-type Eaton supercharger, all three of these blower upgrades are a big improvement! A previous analysis of the 2.3L Lysholm and Eaton M112 can be found here (see post #16&17): http://www.modularfords.com/showthread.php?t=16208
And here's a link to a related thread that you may find of interest.
http://www.modularfords.com/2003-20...eness-of-engine-ve-changes-with-a-positive-displacement-supercharger-41735.html
OK…but enough of all that - on to the results. The first graph shows the VE and AE vs. CFMsc for the Lysholm 2.3L and Autorotor 2.2L compressors, and the second graph shows the resulting drive power vs. air flow. The same ambient conditions and boost pressure are used in both cases. Again, no inertial losses are included. The third and fourth graphs show these same parameters for the Lysholm 2.3L and Autorotor 2.4L compressors, again at a boost pressure of 1 bar = 14.5 psi.